If you read my previous post about sealed system basics, you know that understanding the thermodynamic states of refrigerants (saturated, subcooled, and superheated) is essential to sealed system troubleshooting. In that post, I explained these states in terms of a simple pressure-temperature table. While that keeps things simple, it doesn’t really give you a strong visual and mental model for how the refrigeration cycle works thermodynamically.
That’s why we’re going to spend this whole post learning how to read a P-H diagram. It takes a bit more work than just reading a P-T table, but this diagram is where those values on the P-T table come from, so learning to read it will give you a deeper understanding of what’s going on in the sealed system.
Without further ado, here’s the P-H diagram for the refrigerant R-134a:
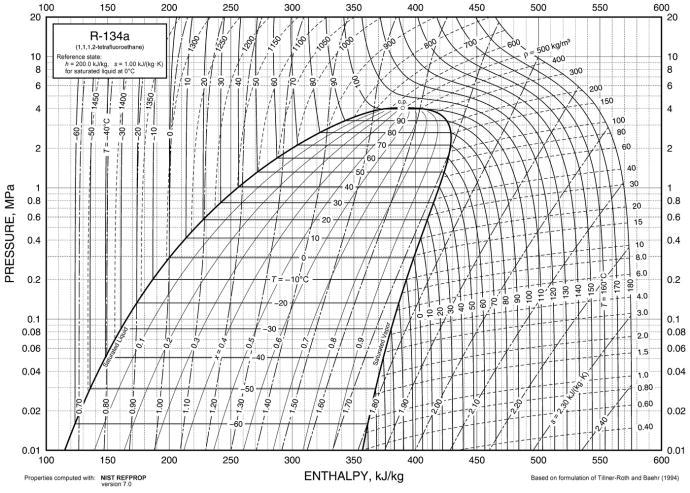
Pretty overwhelming, right? I remember how quickly my eyes started crossing when I first looked at one of these. This diagram conveys a ton of information, but some of it isn’t really necessary for us techs, and the stuff that is useful gets lost in the jumble if you don’t know what to look for. Let’s strip this diagram down to something really simple, then start adding lines back in step by step.
That’s a bit more straightforward! For those who aren’t in the know, the vertical axis labeled P is for pressure, and the horizontal axis labeled h is for enthalpy. That’s not a term we use often, but enthalpy is just a measure of how much heat energy is in the refrigerant. Note that that’s not the same thing as the temperature of the refrigerant — we’ll get into that soon. So the farther up the chart you go, the greater the pressure, and the farther to the right you go, the greater the enthalpy.
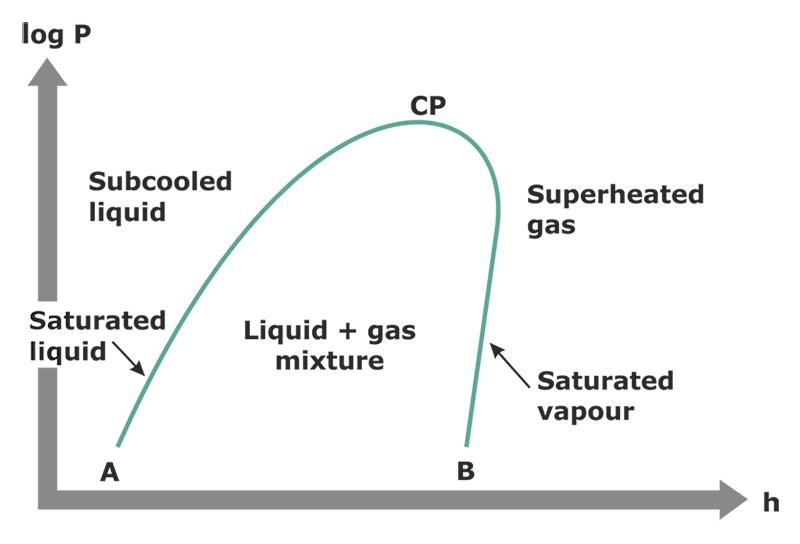
This heavily simplified diagram highlights the centerpiece of the P-H diagram: the saturation dome. As the labels say, when the pressure and enthalpy of the refrigerant places it in that dome, the refrigerant is saturated. That means it’s in the transitional state between a liquid and a vapor — what we commonly refer to as boiling.
The left side of the dome is the liquid side. If a refrigerant is plotted directly on that line, that means that it’s at saturation, but still fully a liquid. If it moves to the left of that line, then it becomes subcooled. So “subcooled” just means that the refrigerant is anywhere to the left of the saturation dome. It doesn’t necessarily mean “really cold” — only “below saturation”.
Conversely, the right side of the dome is the vapor side. A refrigerant plotted directly on that right line is at saturation and fully vapor. If it moves to the right, then it becomes superheated. So “superheated” refers to refrigerant anywhere to the right of the saturation dome. It doesn’t necessarily mean “super hot” — only “above saturation”.
Lets add some of those lines back and take a look at something more like a real P-H diagram, but only with the info we’re concerned with: quality and temperature.
Let’s look at those green lines with percentage labels first. Those are the quality lines. All that quality means is what percentage of the refrigerant is vapor. This one is pretty straightforward to understand: the refrigerant starts as a saturated liquid on the left edge of the dome, and then it steadily transforms into vapor as you move to the right, until it’s all vapor at the right edge.
Those dark blue temperature lines look kinda funky, though — what’s up with those sharp 90 degree turns? This is where we can really get into the cool stuff that happens at saturation and understand how refrigeration works.
First, look at the lines to either side of the dome. The temperature lines are almost entirely vertical, meaning that temperature increases steadily as enthalpy increases. That makes sense — adding heat energy to the system seems like it should make things hotter, right?
But in the saturation dome, the temperature lines are perfectly horizontal: adding or removing heat energy within the saturation dome has no effect on temperature. Kind of wild, right? Instead, while the refrigerant is at saturation, any heat energy that gets added increases the refrigerant’s quality. So all that energy is going toward changing liquid refrigerant into vapor, and none of it is felt as temperature. It’s what we call latent heat, and that absorption of heat energy to change the state of the refrigerant is what we mean when we talk about the refrigeration effect.
Those of you who are getting the hang of reading this chart will notice something else: in the saturation dome, temperature and pressure are in perfect lockstep. If you increase the pressure (moving up the diagram), you also increase the temperature. And decreasing the pressure (moving down the diagram) decreases the temperature. This is a key concept to grasp, because this direct temperature-pressure relationship at saturation is a fantastic sealed system troubleshooting tool. If you take a temperature measurement at a point in the sealed system that’s at saturation, then you know the pressure at that point. No gauges required.
One more addition to the diagram to drive this home: let’s plot the pressure and enthalpy of the refrigerant on the P-H diagram as it moves through the sealed system.
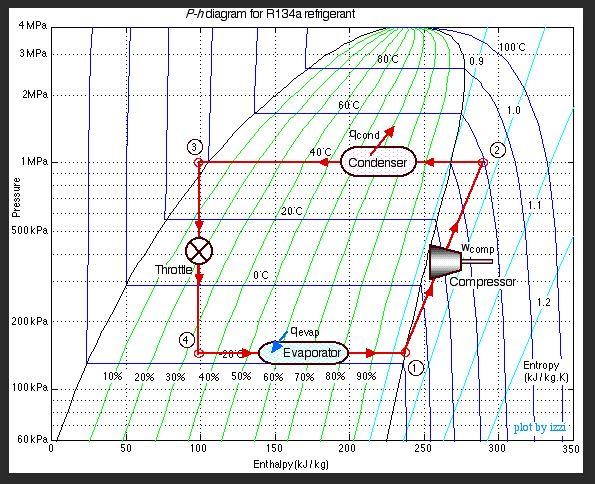
Let’s start at Point 1: That’s the suction line (intake) of the compressor. With our newfound knowledge of how to read the P-H diagram, we can easily see that the compressor increases the pressure of the refrigerant, since the line is moving up. The compressor also superheats the refrigerant a bit, since the line moves out to the right of the saturation dome.
Point 2: Here’s our condenser line. This line is completely horizontal, so we have no change in pressure in the condenser. It’s simply shedding heat energy, moving left all the way through the saturation dome, and even subcooling the refrigerant slightly at the end.
Point 3: The “throttle” is the metering device that separates the high-pressure condenser from the low-pressure evaporator — usually a thin capillary tube in household refrigerators. As the refrigerant exits the capillary tube, its pressure drops drastically. Note, however, that the enthalpy remains the same — the line is completely vertical. But because of the direct relationship between pressure and temperature at saturation, the temperature of the refrigerant plummets with the pressure. In addition, a lot of the refrigerant instantly flashes from liquid to vapor. Judging by the quality line, you can see that 35% of it is already vapor at Point 4
Point 4: The exact opposite of the condenser line: the refrigerant absorbs heat energy from its surroundings, moving all the way to the right of the saturation dome, where it’s saturated vapor.
Believe it or not, there you have it — you now know how to read a P-H diagram! There are other aspects to the diagram that we’ve not covered, but none of that info is necessary for us techs. Hopefully, you can now start using your deeper understanding of the refrigeration cycle to bolster your sealed system troubleshooting.
If you’d like to learn more about troubleshooting and repairing both the controls and the sealed system in refrigerators, then click below to check out our Advanced Refrigerator Repair Course right here at the Master Samurai Tech Academy.